Automated root cause analysis identifies the source of problems in seconds with 84% precision, reducing mean time to resolution by 44%. AI-powered causal networks show exactly what led to failure.
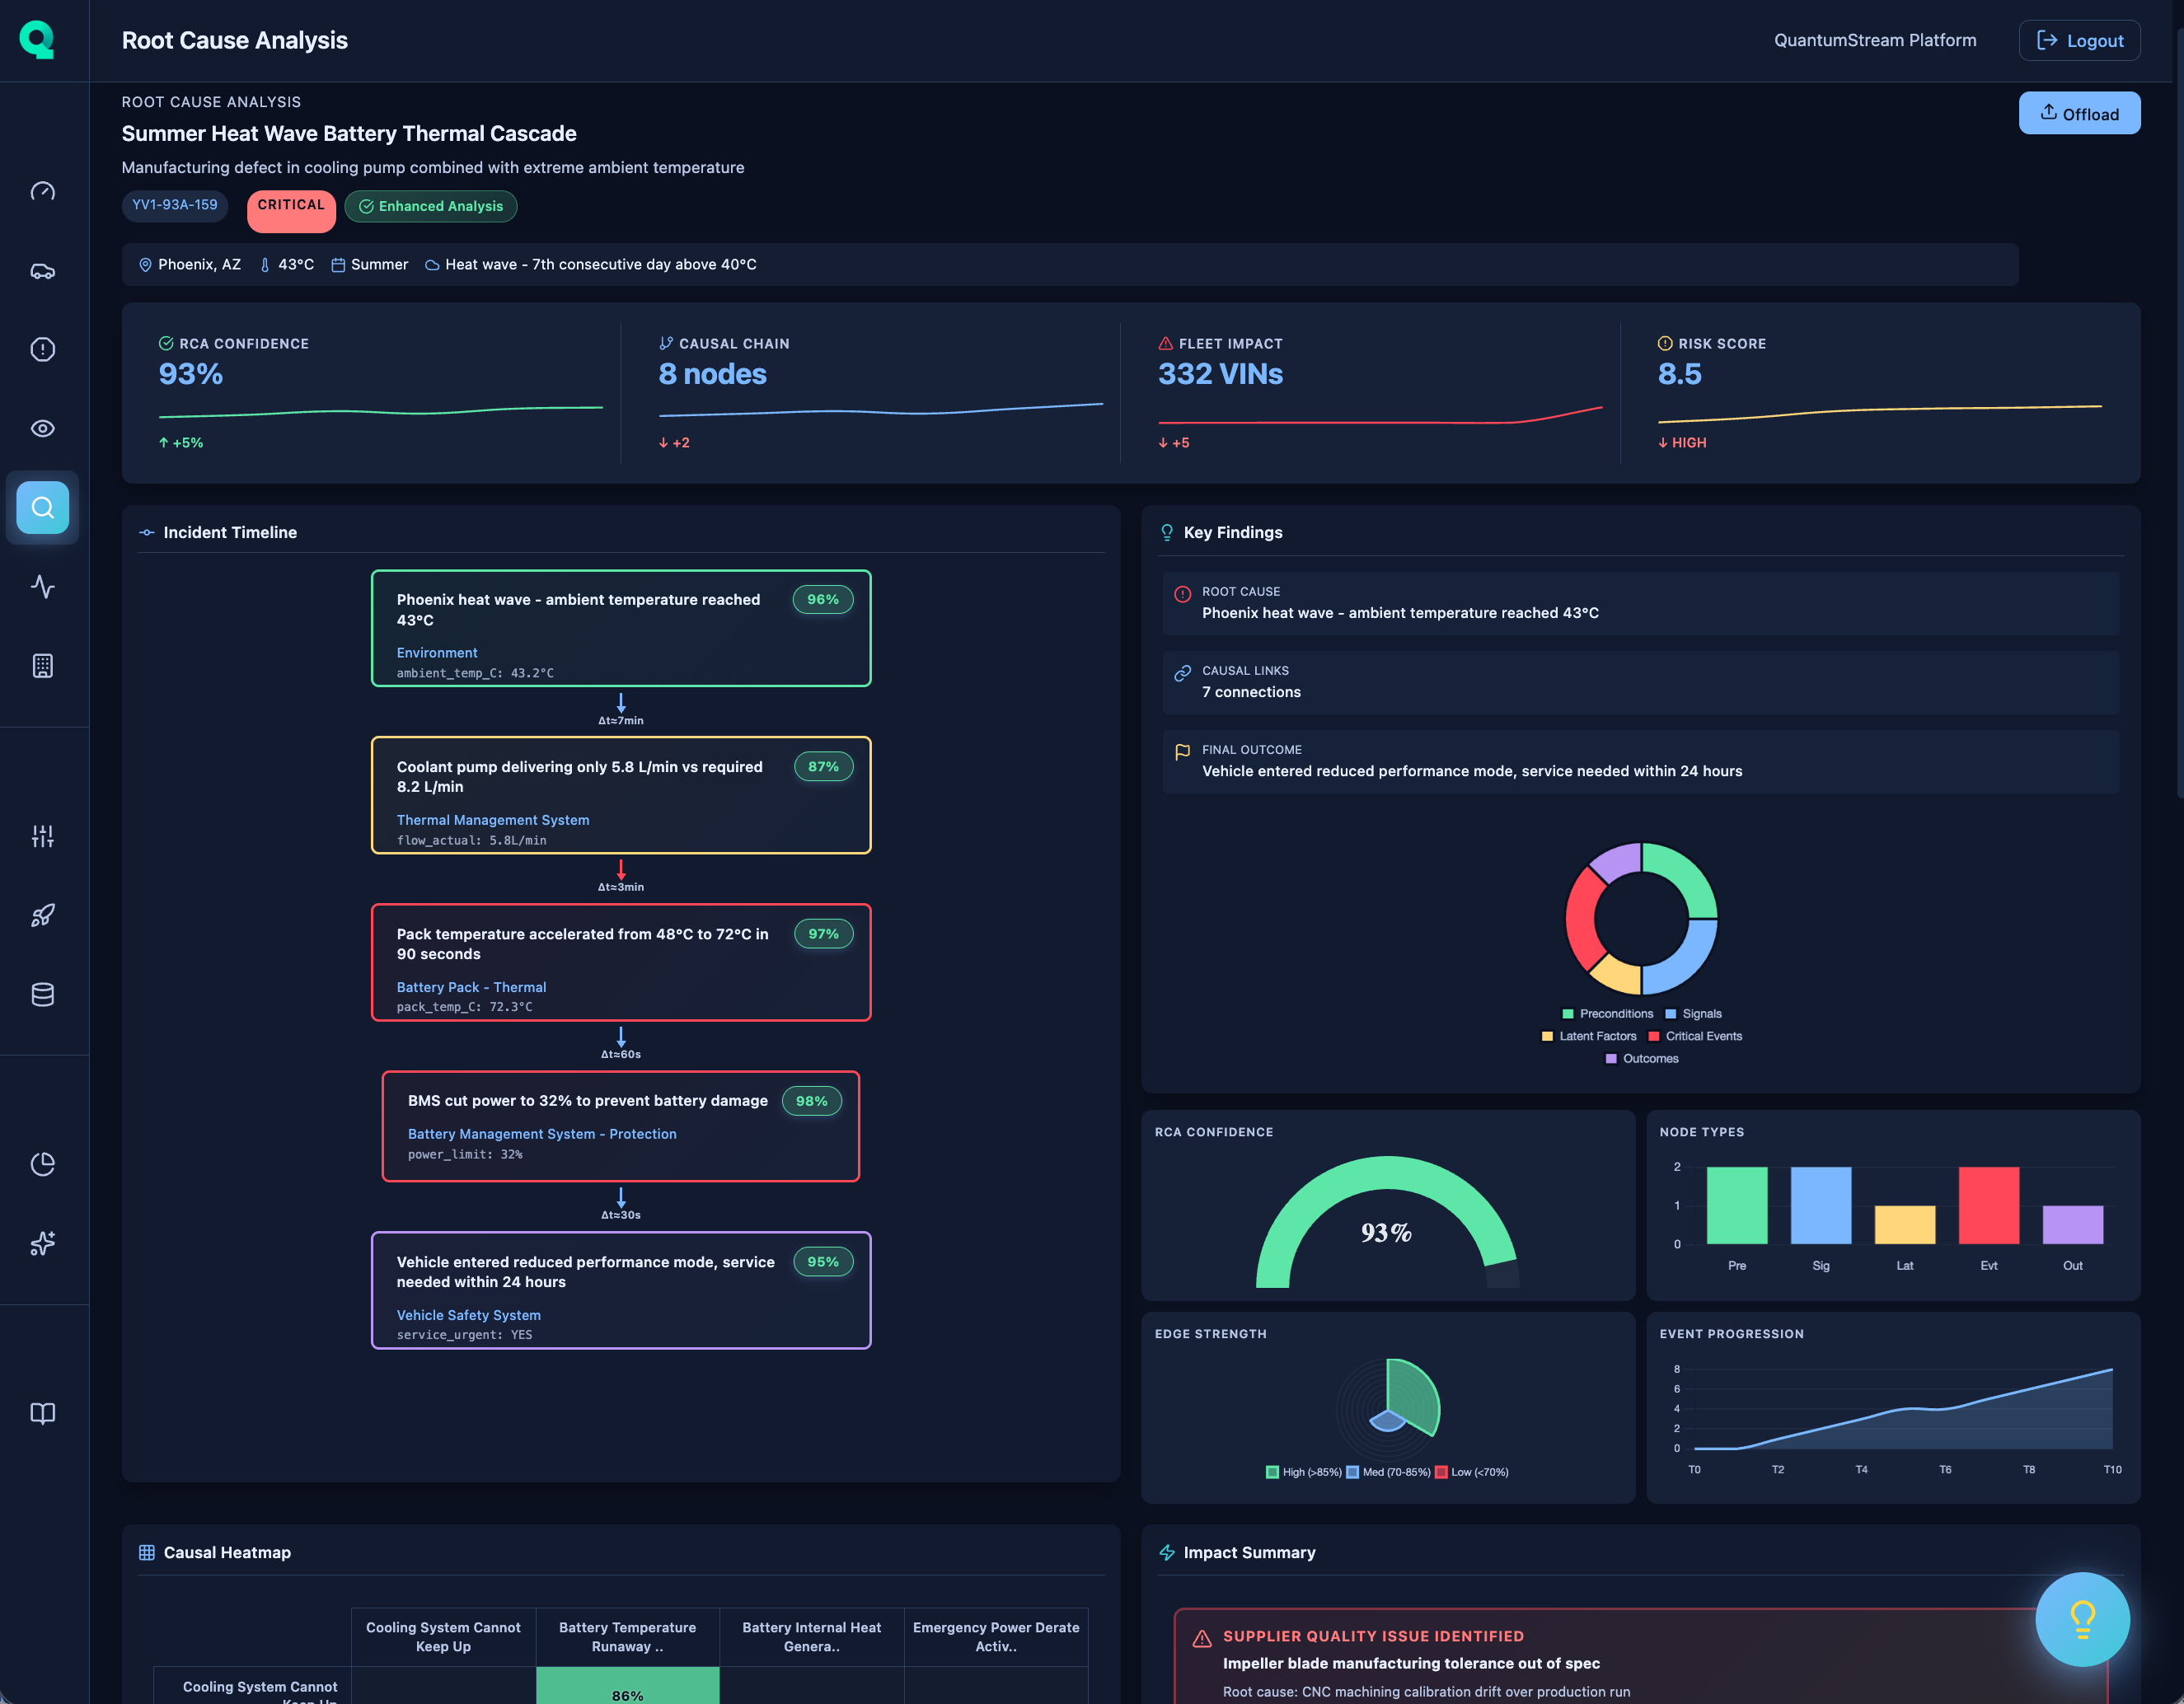
Automated generation of causal graphs showing what led to failure. Node types: Preconditions (blue-gray), Signals (blue), Latent Factors (purple), Events (yellow), Outcomes (green).
Human-readable description, affected component, physical effect explanation, specific sensor readings, and confidence scores for each node in the causal chain.
Top 3-5 telemetry evidence with signal names, observations (e.g., "max 88.2C @ t-0:40"), and confidence badges. Sorted by confidence for quick validation.
What-if interventions showing estimated risk reduction. Example: "Raise fan curve +10%" → "-34% risk". Helps prioritize corrective actions.
6 relevant log entries around incident (t-5min to t+5min) with timestamps, log levels (INFO, WARN, ERROR), and module names for context-aware filtering.
5 key signals plotted from t-10min to t+5min with vertical line marking incident t0. Multi-axis chart supports different units with zoom/pan capabilities.
Supply chain context: supplier name and rating, component batch ID, manufacturing date and plant, affected VINs count, quality issue description, field failure rate.
Frequency matrix showing most common causal patterns fleet-wide. Rows = causes, columns = effects, cell color = occurrence frequency. Identify systemic issues.
MTTR reduced from 3.2h → 1.8h. Automated RCA saves $210 per incident in engineering time.
Per vehicle per year savings. Early detection reduces warranty claims by $825K annually for 1,000-vehicle fleet.
Engineers focus on solutions instead of investigation. New team members become productive immediately with AI-generated explanations.
See how automated root cause analysis can transform incident resolution from hours to minutes.