Zero-click fleet health understanding in 3 seconds. Monitor your entire fleet with real-time dashboards, KPIs, and actionable insights—no clicking through multiple screens.
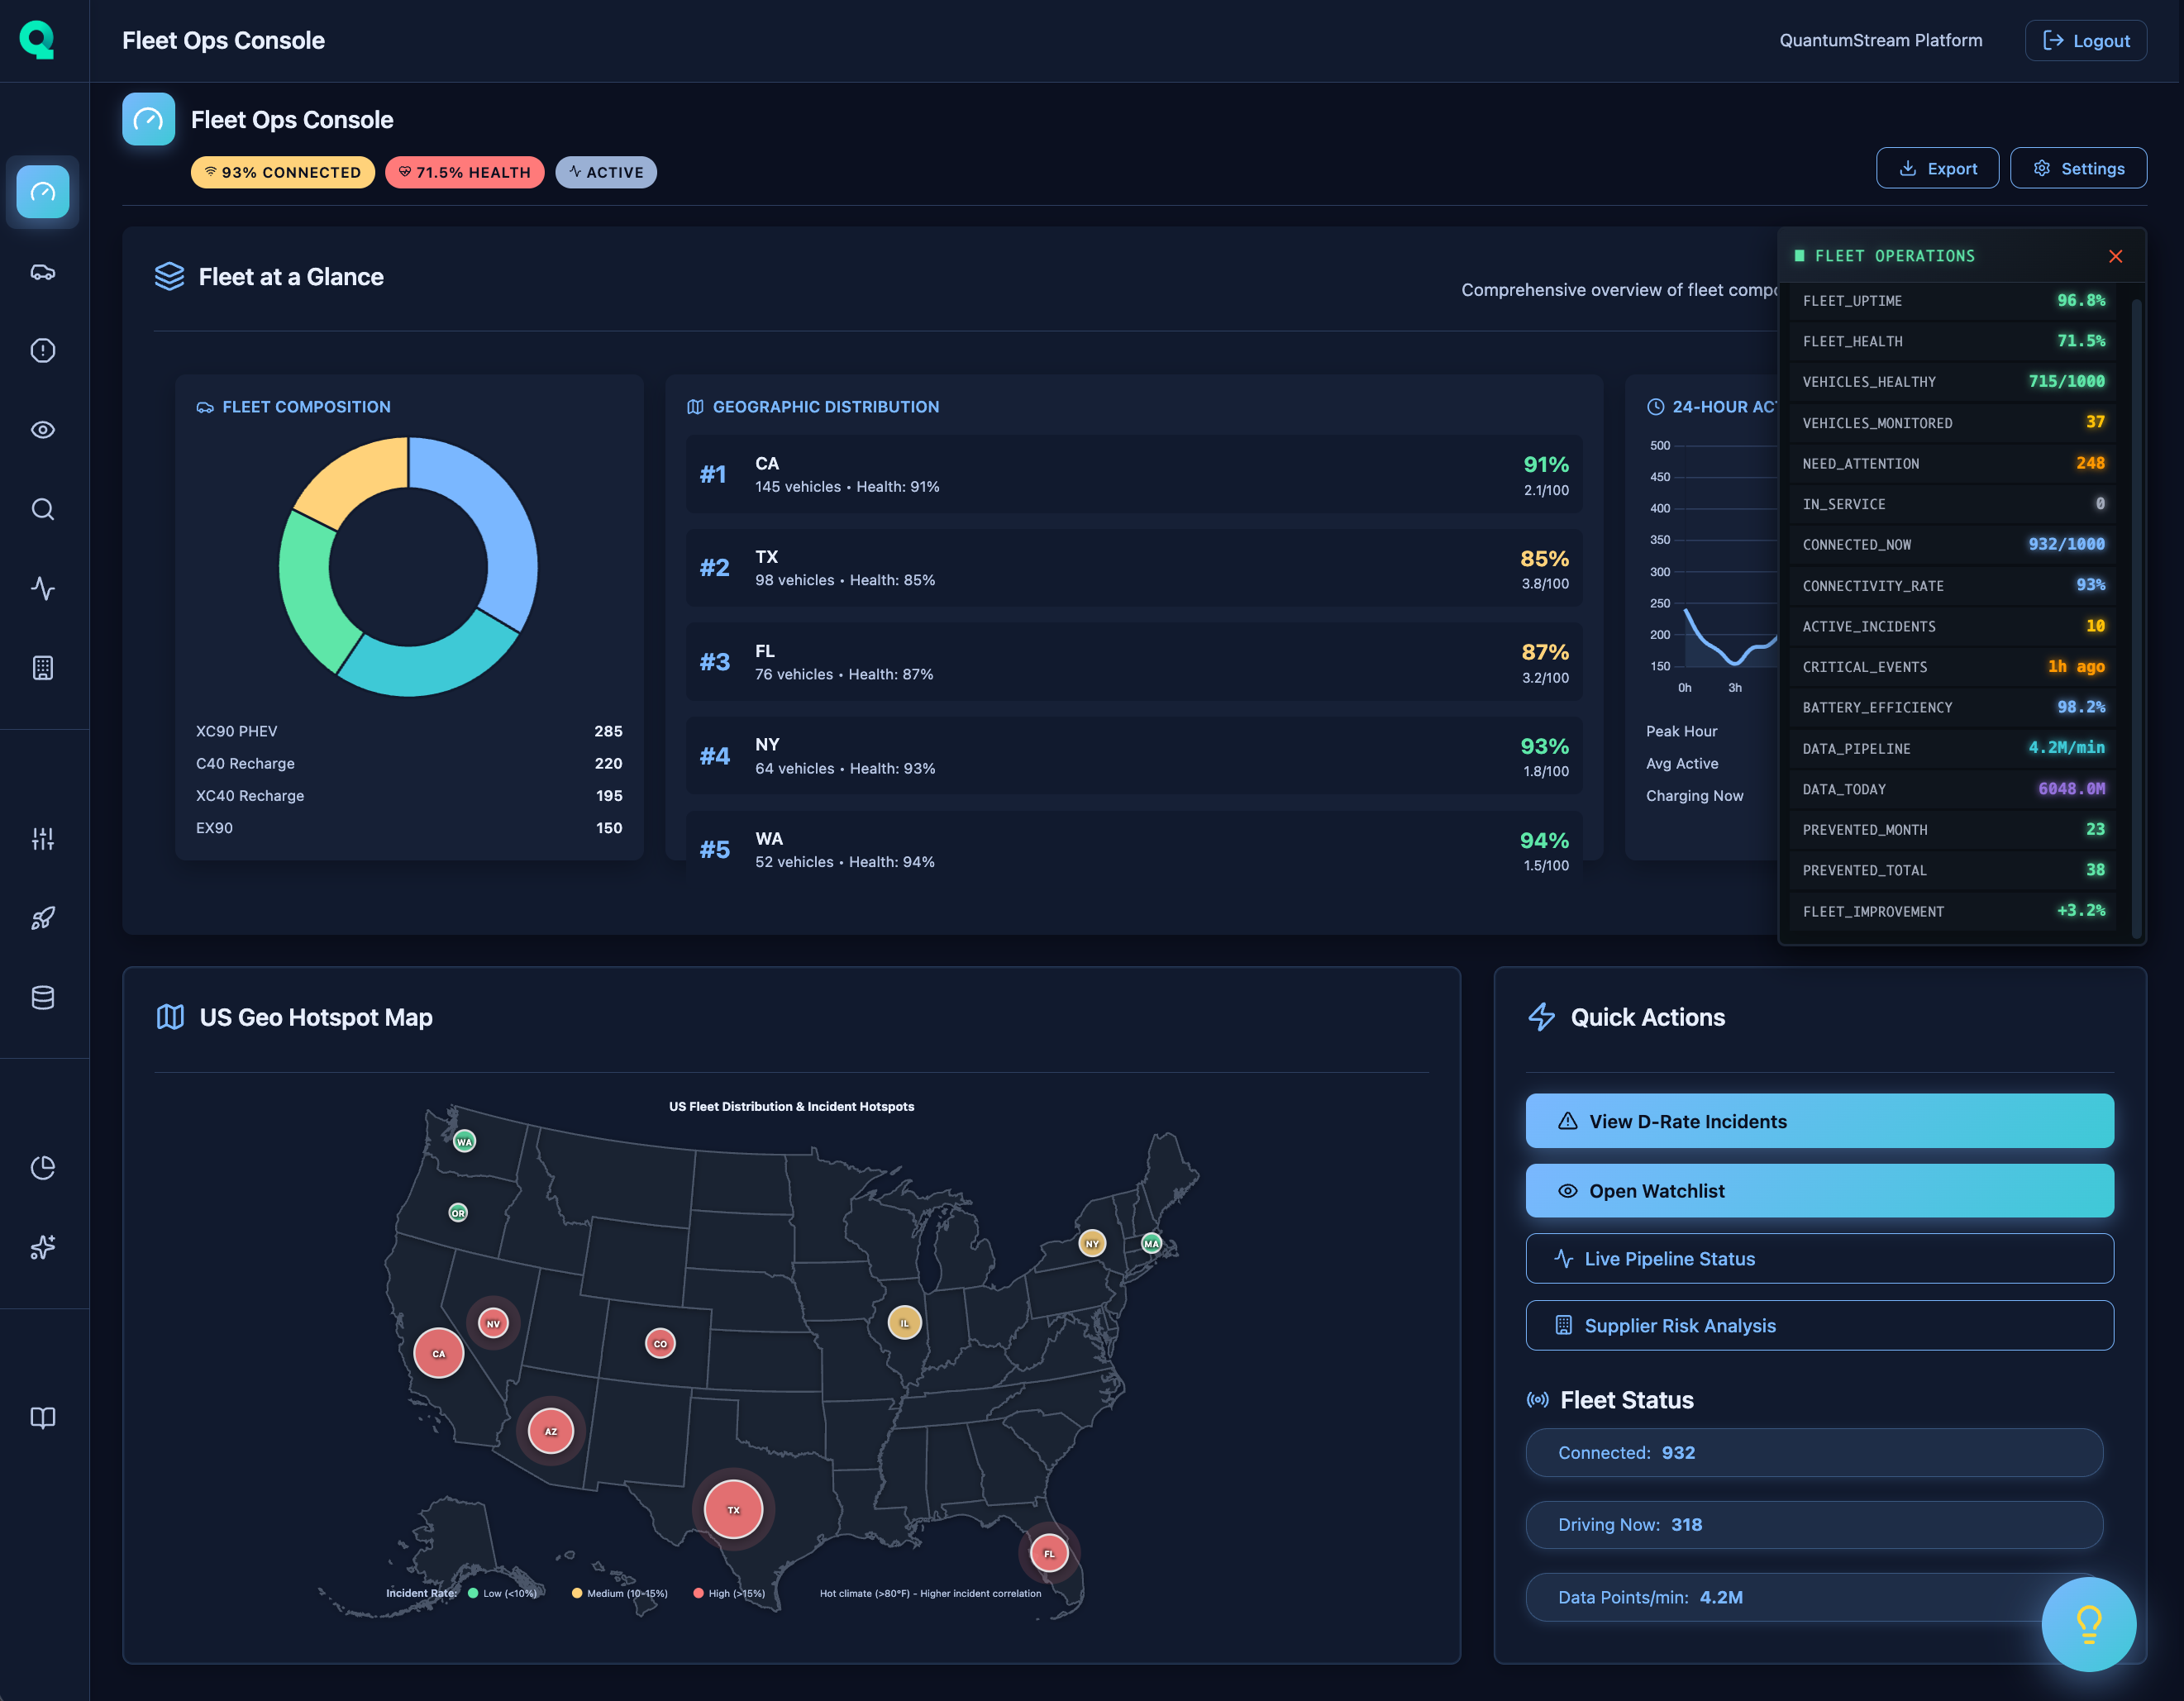
Circular progress indicator with color-coded status (Green >85%, Yellow 70-85%, Red <70%). See breakdown of healthy, monitored, and attention-needed vehicles with trend indicators.
Track D-Rate incidents (24h), MTTR (Mean Time to Resolution), Top Supplier Risk, and RCA Precision@1 accuracy—all with real-time trends.
Interactive US map with incident circles sized by count and colored by rate. Hover for state details, click to drill down into incidents filtered by location.
Primary buttons for viewing D-Rate incidents and opening watchlist. Secondary options for live pipeline status and supplier risk analysis.
Visualize incident trends over 24 hours, breakdown by component (HV Battery, Cooling System, etc.), and severity distribution (Critical, High, Warning, Info).
At-risk vehicles with risk score, prediction horizon, and component details. Most critical incidents with VIN, type, severity, owner, and direct RCA links.
Fleet status pills showing connected count, vehicles driving now, and data points per minute—all updating in real-time for operational visibility.
Click any state on the map to filter incidents by location. Click incidents to view details. Click VINs to see vehicle timelines. Click components to filter by type.
Understand fleet health instantly without clicking through multiple screens or waiting for reports to load.
Identify at-risk vehicles before failures occur. See geographic hotspots for targeted interventions.
Fleet managers, engineers, and executives all get the view they need without custom reports or data exports.
Schedule a personalized demo to see how FleetOps Console 360 can transform your fleet operations.